
Most fintech founders struggle to connect partner commission structures to unit economics. The core issue is that increasing commissions can drive acquisition volume while simultaneously eroding profitability, or, when structured correctly, attract higher-quality customers who stay longer and generate more lifetime value. The decision hinges on three measurable factors: how commissions affect customer acquisition cost (CPA), how payment timing impacts cash flow, and whether the customers acquired actually generate recognized revenue after accounting for refunds, chargebacks and servicing costs.
This framework helps founders and partnership leaders decide whether to increase partner payouts by modeling three distinct commission structures, upfront CPA, recurring revenue share, and hybrid arrangements, against a transparent illustrative customer cohort. The analysis reveals when higher commissions improve unit economics and when they destroy them, and what evidence must be reviewed before committing to a new structure.
Quick answer: should you increase partner commissions?
Increasing partner commissions improves unit economics only if the higher acquisition volume and customer quality generate retained revenue exceeding the total payout cost within your measurement period.
A founder should increase commissions when: (1) current customers are undermonetized relative to acquisition cost; (2) higher payouts attract partners who deliver customers with lower churn and higher transaction frequency; (3) cash flow can sustain the timing gap between upfront payouts and revenue realization.
Increasing commissions destroys economics when partners respond by flooding the channel with low-retention customers, or when the business lacks the cash runway to absorb front-loaded commission costs before revenue materializes.
Who this decision is for
This decision applies to fintech founders, partnership leaders, and product operators managing:
- Affiliate or referral programs where commission rates directly affect partner incentives and acquisition channel economics
- Prop firm or trading platform operations with multiple distribution channels competing for resources and attention
- Payments or broker platforms evaluating whether to raise commissions to accelerate customer acquisition or defend market share
- Early-stage fintechs balancing growth velocity against cash flow constraints and profitability thresholds
The framework assumes you can calculate or access current customer lifetime value (LTV), average transaction frequency, churn rates, and refund/chargeback rates by channel. If these data are unavailable, the decision cannot be made reliably; the verification section below flags this gap.
The decision criteria
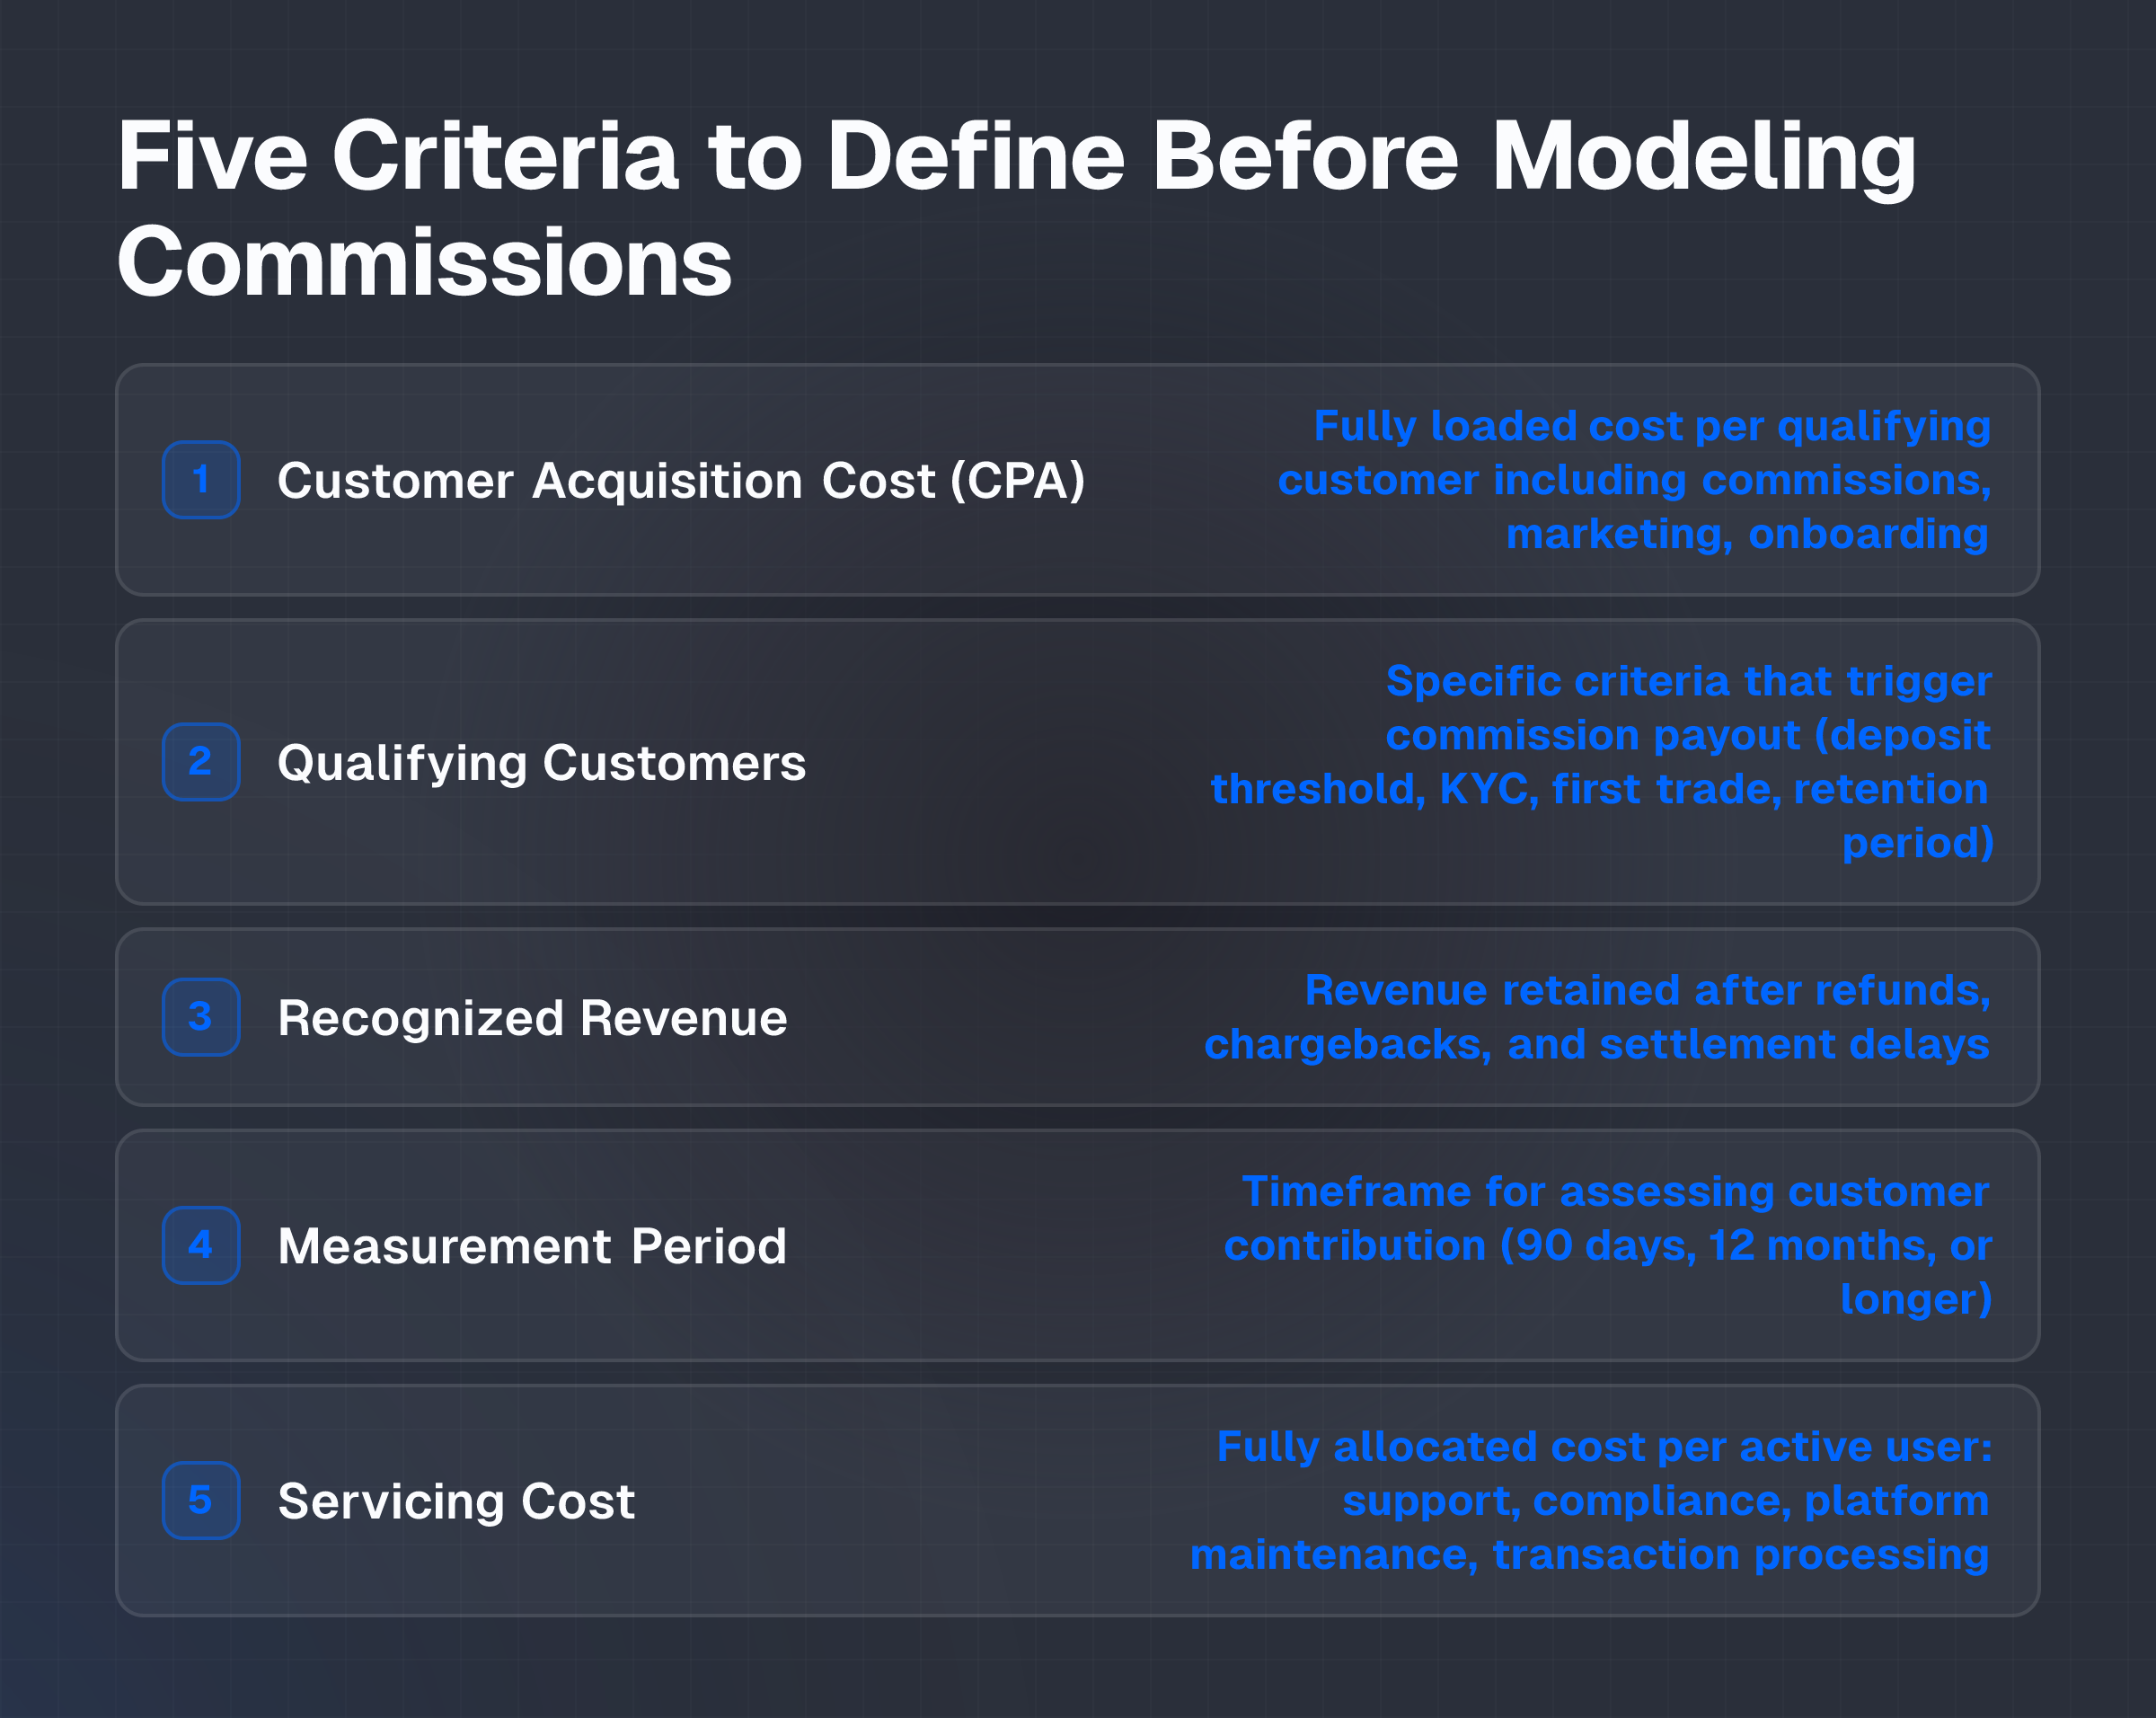
The decision rests on five measurable criteria. Each must be defined before modeling commission scenarios.
1. Customer Acquisition Cost (CPA): The fully loaded cost to acquire one qualifying customer, including commissions, marketing support, onboarding overhead and payment processing. Express as a single figure per customer.
2. Qualifying Customers: The specific criteria a referred customer must meet to trigger a commission payout. Examples: minimum deposit of $1,000; completion of know-your-customer (KYC) verification; execution of first trade within 30 days; account active for 90 days without chargeback. Without precise qualification rules, partners dispute payouts and customers qualify who generate no revenue.
3. Recognized Revenue: The revenue recorded on financial statements after accounting for refunds, chargebacks, and the time required for settlement. For a trading platform, this isn't the notional deposit amount, but the net commissions and fees retained after customer withdrawals and failed trades. For a broker, it's realized spreads and commissions, not gross deposit volume.
4. Measurement Period: The timeframe over which customer contribution is assessed, typically 12 months for LTV, but can be 90 days, 6 months, or longer depending on customer lifecycle and revenue visibility. Longer periods reduce cash flow urgency but increase forecast uncertainty.
5. Servicing Cost: The fully allocated cost to support each customer: platform maintenance, customer support, compliance and transaction processing per active user per period. This is often underestimated and drives the difference between gross revenue and contribution margin.
Options and trade-offs
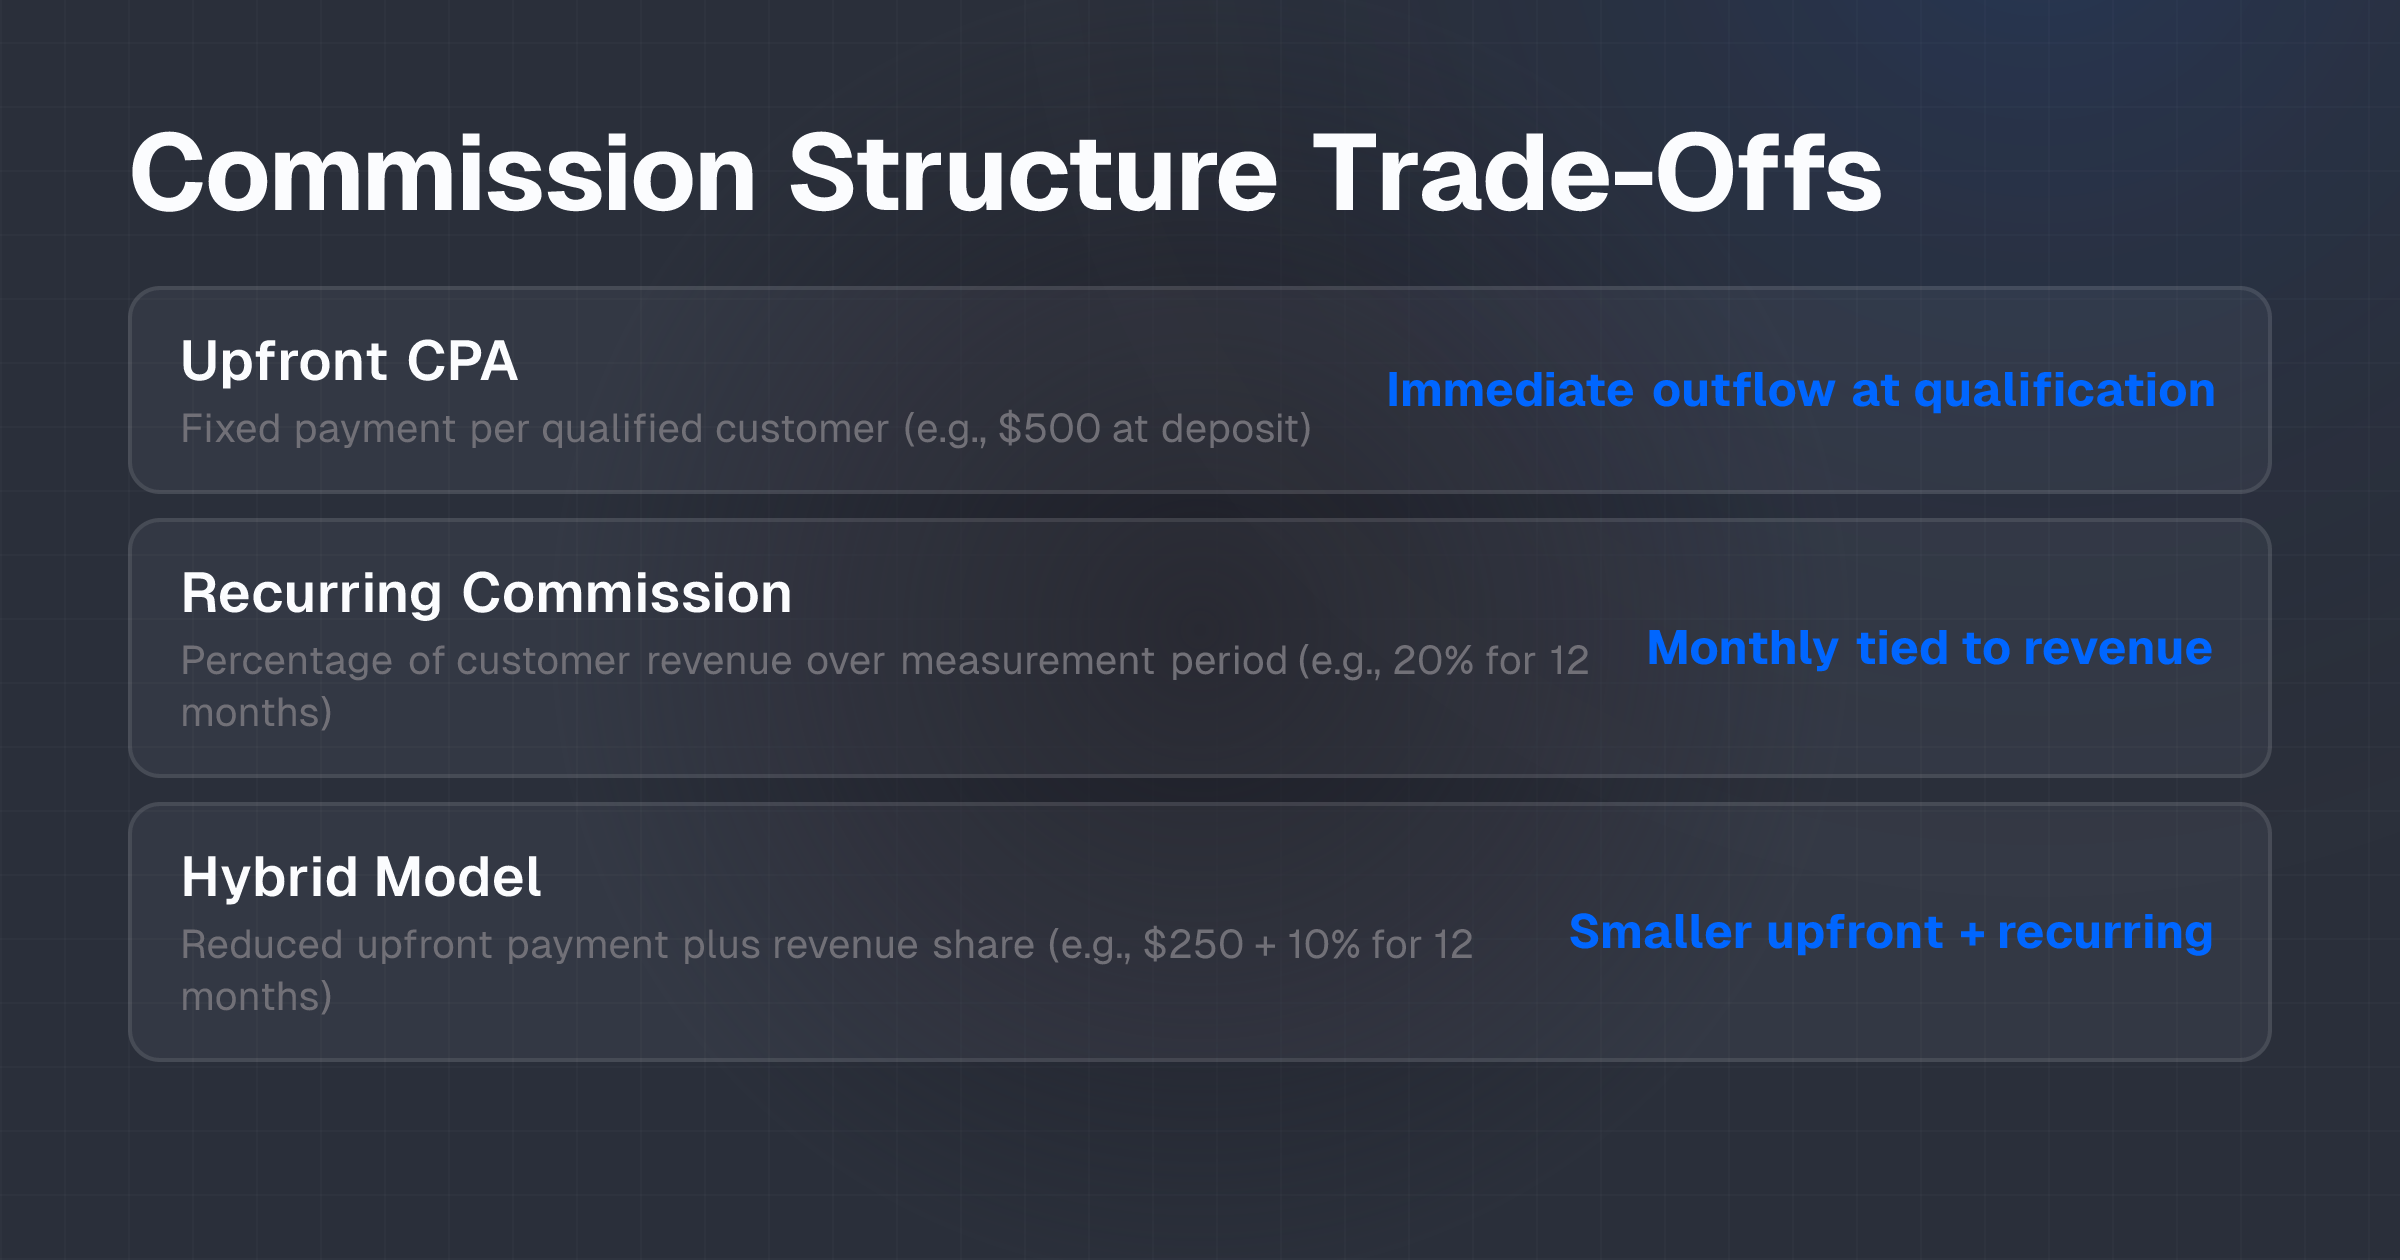
Three commission structures exist. Each creates different trade-offs between acquisition speed, cash flow strain, and customer quality incentives.
Option 1: Upfront CPA Model
Structure: Partner receives a fixed cash payment at qualification (e.g., $500 per customer who deposits $1,000 and completes KYC).
When acquisition speed matters more than retention:
- Early-stage platforms needing rapid customer growth to build critical mass
- Seasonal or event-driven acquisition windows with fixed capital budgets
- Channels where customer quality is already verified by the partner (e.g., referrals from established trading educators)
Trade-offs:
- Positive: Cash cost is immediate and predictable. Partners have clear incentive to qualify customers quickly. Easy to calculate ROI per customer at acquisition.
- Negative: High upfront cash drain before revenue arrives. Attracts partners focused on volume over quality. If qualifying criteria are weak, customer cohort may churn rapidly, leaving platform with sunk acquisition cost and no revenue offset.
Option 2: Recurring Commission Model
Structure: Partner receives a percentage of revenue generated by the customer (e.g., 20% of net trading commissions) paid monthly or quarterly over a defined measurement period (e.g., 12 months).
When customer quality and retention are the priority:
- Mature platforms with predictable customer lifetime revenue
- Channels where partner reputation is at stake if customers underperform
- Businesses with long customer lifecycles where upfront cash is available and deferred payouts are acceptable
Trade-offs:
- Positive: Commission expense is tied to actual revenue realization. Partners have strong incentive to deliver engaged, retained customers. Lower peak cash outlay.
- Negative: Revenue forecasting must be accurate; overestimated retention inflates partner expectations and actual payout liabilities. Disputes over "recognized revenue" definition are common. Partners may deprioritize the channel if payouts are delayed or calculation methodology is opaque.
Option 3: Hybrid Model
Structure: Partner receives a smaller upfront CPA ($250) plus a recurring revenue share (10% of net commissions for 12 months).
When acquisition velocity and retention both matter:
- Growing platforms needing to scale channels without unlimited upfront capital
- Competitive markets where partners choose between multiple platforms based on total lifetime earnings
- Businesses with medium cash runway that can absorb front-loaded costs if revenue compounds quickly
Trade-offs:
- Positive: Balances partner incentive between acquiring customers and keeping them active. Upfront payment seeds partner motivation; recurring component sustains it. More flexible for partners with different risk tolerance.
- Negative: More complex to model, track and audit. Two payment streams create two reconciliation points and higher operational overhead. Partners must understand the structure clearly, or disputes multiply.
Cost, risk and implementation implications
Cash Flow Impact: Timing Mismatch
The gap between commission payout and revenue realization is the largest operational risk.
Upfront CPA Model:
- Day 0: Partner paid $500 per customer (e.g., 100 customers = $50,000 cash outflow)
- Day 90: Revenue recognition begins (customers active, deposits retained)
- Day 365: Full annual revenue realized
- Risk: If churn hits 40% by day 90, platform has paid $50,000 for 60 retained customers = $833 effective CPA, but only 60 × $X recognized revenue. Cash is gone; revenue is partial.
Recurring Commission Model:
- Day 0: Partner invoices platform for first month's share (e.g., 100 customers × $50 average monthly commission × 20% share = $1,000)
- Day 30-365: Monthly invoicing tied to actual trading activity
- Risk: If customers are inactive or revenue is lower than forecast, payouts are naturally lower. But if platform forecasted payouts and committed to partner budgets, actual revenue shortfall creates a liability mismatch.
Hybrid Model:
- Day 0: Partner paid $25,000 upfront ($250 × 100 customers)
- Day 30-365: Monthly revenue share reconciliation ($500, $1,000 per month, depending on activity)
- Risk: Combines both timing risks. Requires strong cash position to absorb $25,000 upfront while revenue ramps slowly.
Implementation: Model the 90-day, 180-day and 12-month cash impact of each structure under three scenarios: base case (forecast retention), downside (40% churn), and upside (improved retention). Identify the point at which each model breaks even and the total cash requirement before breakeven.
Customer Quality Risk: "Churn and Burn" Dynamics
High upfront commissions attract partners optimizing for volume, not value.
- Symptom: Cohort acquired via upfront CPA shows 50%+ churn by day 90; recurring commission cohort shows 30% churn because partners vetted quality more carefully.
- Measurement: Track churn, refund rate, and average transaction count by partner and commission structure. If upfront-CPA cohorts churn 2× faster than recurring-commission cohorts, the higher CPA is offset by lower LTV.
- Mitigation:
- Define "qualifying customer" to include a minimum activity threshold (e.g., first trade executed within 7 days, not just deposit received).
- Require partners to maintain a quality score or minimum retention rate to unlock bonus payouts.
- Cap monthly payouts per partner to prevent single-channel concentration and forced quality trade-offs.
Recognized Revenue Risk: Refunds and Chargebacks
Commissions are often calculated on gross revenue before refunds and chargebacks are deducted. This creates a liability.
Example: Partner sold 100 customers, each depositing $1,000 (gross $100,000). Platform paid 20% recurring commission ($20,000) based on gross revenue. By day 60, 30% of customers requested refunds ($30,000 refunded). Net recognized revenue is $70,000, but platform already paid $20,000 commission, a net margin of $50,000 instead of $70,000.
Implementation:
- Define recognized revenue as money retained after a chargeback/refund period (typically 60-90 days).
- Tie recurring commissions to recognized revenue, not gross deposits.
- For upfront CPA, require clawback terms: if a customer refunds within 60 days, partner repays a portion of commission or platform reduces next-month payouts.
- Document the definition in partner agreements and reconcile monthly to prevent disputes.
Servicing Cost and Contribution Margin
Most founders underestimate the cost to service a customer, which erodes the value of higher commissions.
Example:
- Customer acquired via upfront CPA: $500 commission
- Customer generates $1,200 gross revenue over 12 months
- Servicing cost (support, compliance, platform maintenance): $400
- Net contribution: $1,200 − $500 − $400 = $300
If commissions increase to $750 and servicing cost stays $400, net contribution falls to $50. The higher commission has eroded profitability despite higher gross revenue.
Implementation:
- Calculate servicing cost per customer per month. Include:
- Proportion of customer support headcount and tools
- Compliance and AML processing overhead per KYC
- Platform infrastructure cost (compute, storage, network per concurrent user)
- Transaction processing fees to liquidity providers or payment processors
- Model commission increases against servicing cost. If servicing cost is high, contribution margin is thin, and commission increases compress profitability quickly.
Which option fits which situation
| Situation | Best Option | Reasoning |
|---|---|---|
| Startup with <6 months cash runway; needs rapid customer volume to hit KPIs for next funding round | Upfront CPA (low CapEx, high volume) or Hybrid (balanced) | Upfront CPA minimizes cash outlay per customer but requires harsh discipline on qualifying criteria to prevent churn-and-burn. Hybrid adds complexity but reduces peak cash burn. |
| Mature platform with 12+ month cash position; strong unit economics established; scaling via channel diversification | Recurring Commission | Aligns partner incentives with platform profitability. Partners attract quality customers because their earnings depend on retention. Platform has cash to absorb revenue timing risk. |
| High-touch, high-LTV customer segments (e.g., institutional traders, premium affiliates) | Hybrid or Recurring Commission | Upfront CPA is too crude; these partners understand and prefer variable-pay models tied to customer performance. Hybrid preserves upfront seed capital for partner motivation. |
| Competitive market with multiple fintech platforms courting the same partners | Hybrid | Upfront payment shows commitment and seeds partner confidence. Recurring component offers upside if the partner delivers. Total lifetime earnings potential is higher, making the platform more attractive than a pure upfront competitor. |
| Channel with proven low churn and high transaction frequency | Upfront CPA | Customers are pre-qualified by partner network or reputation. Volume-focused CPA maximizes short-term acquisition and cash recovery. Recurring tie-up is unnecessary. |
| Unproven channel or new geographic market with uncertain customer quality | Recurring Commission or low Hybrid | Limits downside risk if customer quality is poor. Commissions auto-adjust with actual revenue. If channel underperforms, platform exposure is capped by actual results. |
What to verify before deciding
Before committing to a commission increase, confirm each of the following:
1. Define Recognized Revenue Precisely
- Does recognized revenue include or exclude customer refunds? Chargeback reversals? Failed trades that generate no fees?
- Over what period are refunds eligible? (30 days, 60 days, 90 days?)
- Who bears the cost of a chargeback: platform or partner?
- Write the definition into the partner agreement. Calculate the gap between gross revenue and recognized revenue for existing customers; if it's >20%, commission increases will erode margins faster than expected.
2. Model a Transparent Illustrative Customer Cohort
- Select a cohort of 100 customers acquired in a recent month via an existing channel.
- Track, for 12 months, their:
- Gross revenue generated (deposits, commissions, fees)
- Recognized revenue (after refunds, chargebacks, time delays)
- Churn rate (month-by-month)
- Average transaction frequency
- Total servicing cost allocated to the cohort
- Calculate net contribution per customer under current commission rates.
- Model the same cohort under the proposed new commission rate. Show the impact on per-customer contribution and total cohort profitability.
- If net contribution falls below a minimum threshold (e.g., 15-20% of recognized revenue), increase isn't justified.
3. Verify Named Provider Terms and Maximum vs. Actual Rates
- If benchmarking against competitor commission rates, distinguish between advertised maximums and actual paid rates.
- Example: NextTrade Partners advertises "Up to $1,500 per referred trader," but achieving that rate typically requires a referred trader to deposit $10,000+, complete KYC within 24 hours, and execute a qualifying trade. Most referred traders don't meet all criteria; actual average payout is $400, $600.
- Request historical payout data from platforms or partners if available. Calculate your platform's likely actual rate, not the advertised maximum.
4. Establish Baseline Unit Economics by Channel
- Calculate current CPA, LTV and contribution margin for each acquisition channel (organic, affiliate, paid media, partnership, etc.).
- If a channel is already marginally profitable (LTV ÷ CPA < 3), increasing commissions may push it negative.
- If a channel has strong unit economics (LTV ÷ CPA > 5), there may be room for commission increases and still improve profitability.
5. Confirm Cash Position and Runway
- Model peak cash outlay under the new commission structure. For upfront CPA, this is straightforward: commission per customer × expected monthly customer volume.
- For recurring or hybrid, model the worst-case scenario where monthly customer volume doubles (increasing cash commitment) and average transaction value is 20% lower than forecast.
- Confirm that peak cash need doesn't exceed 40-50% of total available cash. If it does, platform risks underfunding product, compliance or customer support to service commissions.
6. Track Qualifying Customer Definition and Compliance
- Define exactly what constitutes a "qualifying customer" for commission payout. Without precision, disputes are inevitable.
- Ensure the definition is objective and auditable: e.g., "Deposit of ≥$X received and verified; KYC status = approved; first trade executed within 30 days."
- Implement automated reconciliation of qualifying events. Manual review is expensive and error-prone.
- Review partner agreements quarterly to identify drift in interpretation. Partners will optimize for maximum payouts; clear terms reduce conflict.
7. Assess Refund and Chargeback History
- Calculate the refund rate and chargeback rate for existing customers. If >15% of deposits are refunded or chargebacked within 90 days, recognized revenue is severely impacted.
- Model how refund/chargeback rates change under a higher commission regime. If higher commissions attract lower-intent customers, refund rates may increase, further eroding profitability.
- Build a clawback or holdback mechanism into partner agreements: hold 10-15% of recurring commissions in reserve for 90 days to cover potential refunds, then remit or reconcile the balance.
Next step
Before raising partner commissions, prepare a one-page decision sheet for each major acquisition channel:
- Current economics: CPA, LTV, contribution margin per customer, monthly volume, total monthly commission cost.
- Proposed change: New commission rate, projected volume uplift (if any), projected LTV impact (if any), new contribution margin per customer.
- Cash impact: Peak monthly cash outlay under upfront or hybrid model; cumulative payout obligation under recurring model; cash runway remaining after commission commitment.
- Quality gates: Qualifying customer definition, churn threshold, refund/chargeback tolerance.
- Break-even point: The month in which cumulative recognized revenue from the new cohort exceeds cumulative commission cost.
- Go/no-go decision: Commission increase is justified if net contribution per customer remains positive and break-even occurs before cash runway expires.
If the decision sheet shows negative contribution or break-even beyond your cash runway, don't increase commissions. Instead, audit servicing costs, improve customer retention, or negotiate lower fees with liquidity providers and payment processors. The constraint is rarely the commission rate; it's usually the underlying unit economics.
Founders evaluating complex operator decisions can explore structured approaches to decision-making, including how to implement AI governance in fintech operations to track partner cohort performance and make better operating decisions with incomplete data. Additional frameworks on fintech infrastructure decisions are available in the AI ROI in fintech cluster, including cost comparison for AI vs. hiring and which business processes to automate.