The MACD (Moving Average Convergence Divergence) indicator
The MACD (Moving Average Convergence Divergence) indicator is one of the most widely used tools in technical analysis, developed by Gerald Appel in the late 1970s. It’s designed to reveal changes in the strength, direction, momentum, and duration of a trend in a stock’s price. Understanding how the MACD works and how to interpret its signals can be a valuable addition to a trader’s toolkit.
How the MACD Indicator Works
The MACD Indicator is calculated by subtracting the 26-period Exponential Moving Average (EMA) from the 12-period EMA. This creates the MACD line. A second line, called the signal line, is then plotted on top of the MACD line, typically a 9-period EMA of the MACD itself. The combination of these lines can help traders identify buy and sell signals.
A way to intuitively understand what MACD can show you is to understand that it shows an interplay of two trends: a slower one (average with larger period) and the faster one (smaller period). If, for example, the slower one is still trending upwards, but the faster one crosses it from above, this typically means that the market is slowing down and vice versa.
The formula is as follows:
MACD = EMA12 – EMA26

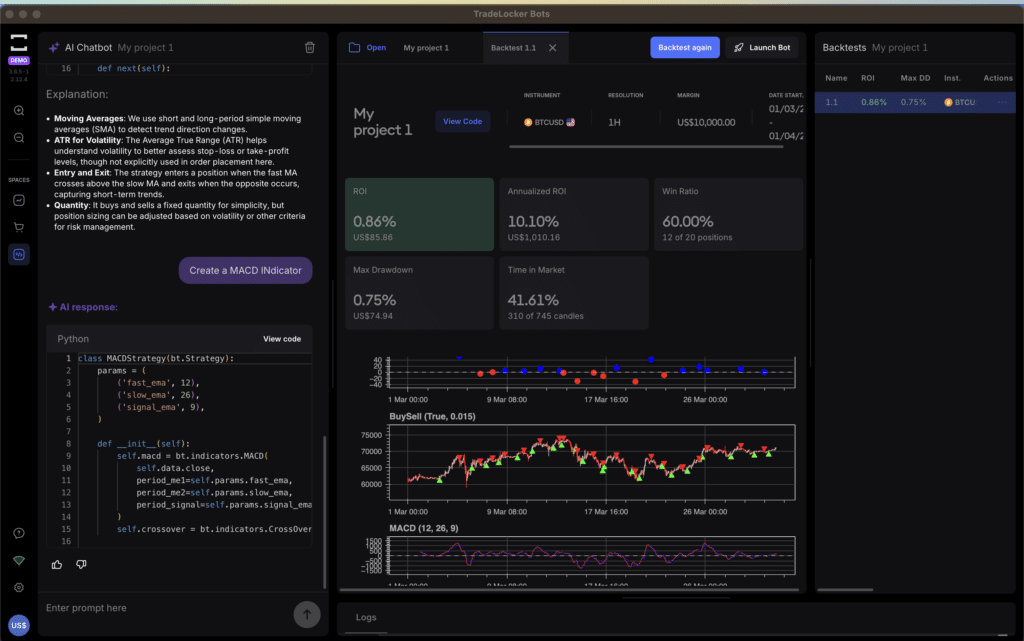
MACD Indicator prompt
Components of the Strategy
1. MACD Line: The main line, is calculated as the difference between the 12-period and 26-period EMAs. This line oscillates above and below the zero line, providing a visual representation of momentum.
2. Signal Line: A 9-period EMA of the MACD line, which acts as a trigger for buy or sell signals. When the MACD crosses above the signal line, it’s considered a bullish signal; conversely, when it crosses below, it’s seen as bearish.
3. Histogram: The difference between the MACD line and the signal line is displayed as a histogram. Positive values indicate the MACD is above the signal line (bullish momentum), while negative values show the MACD is below the signal line (bearish momentum).

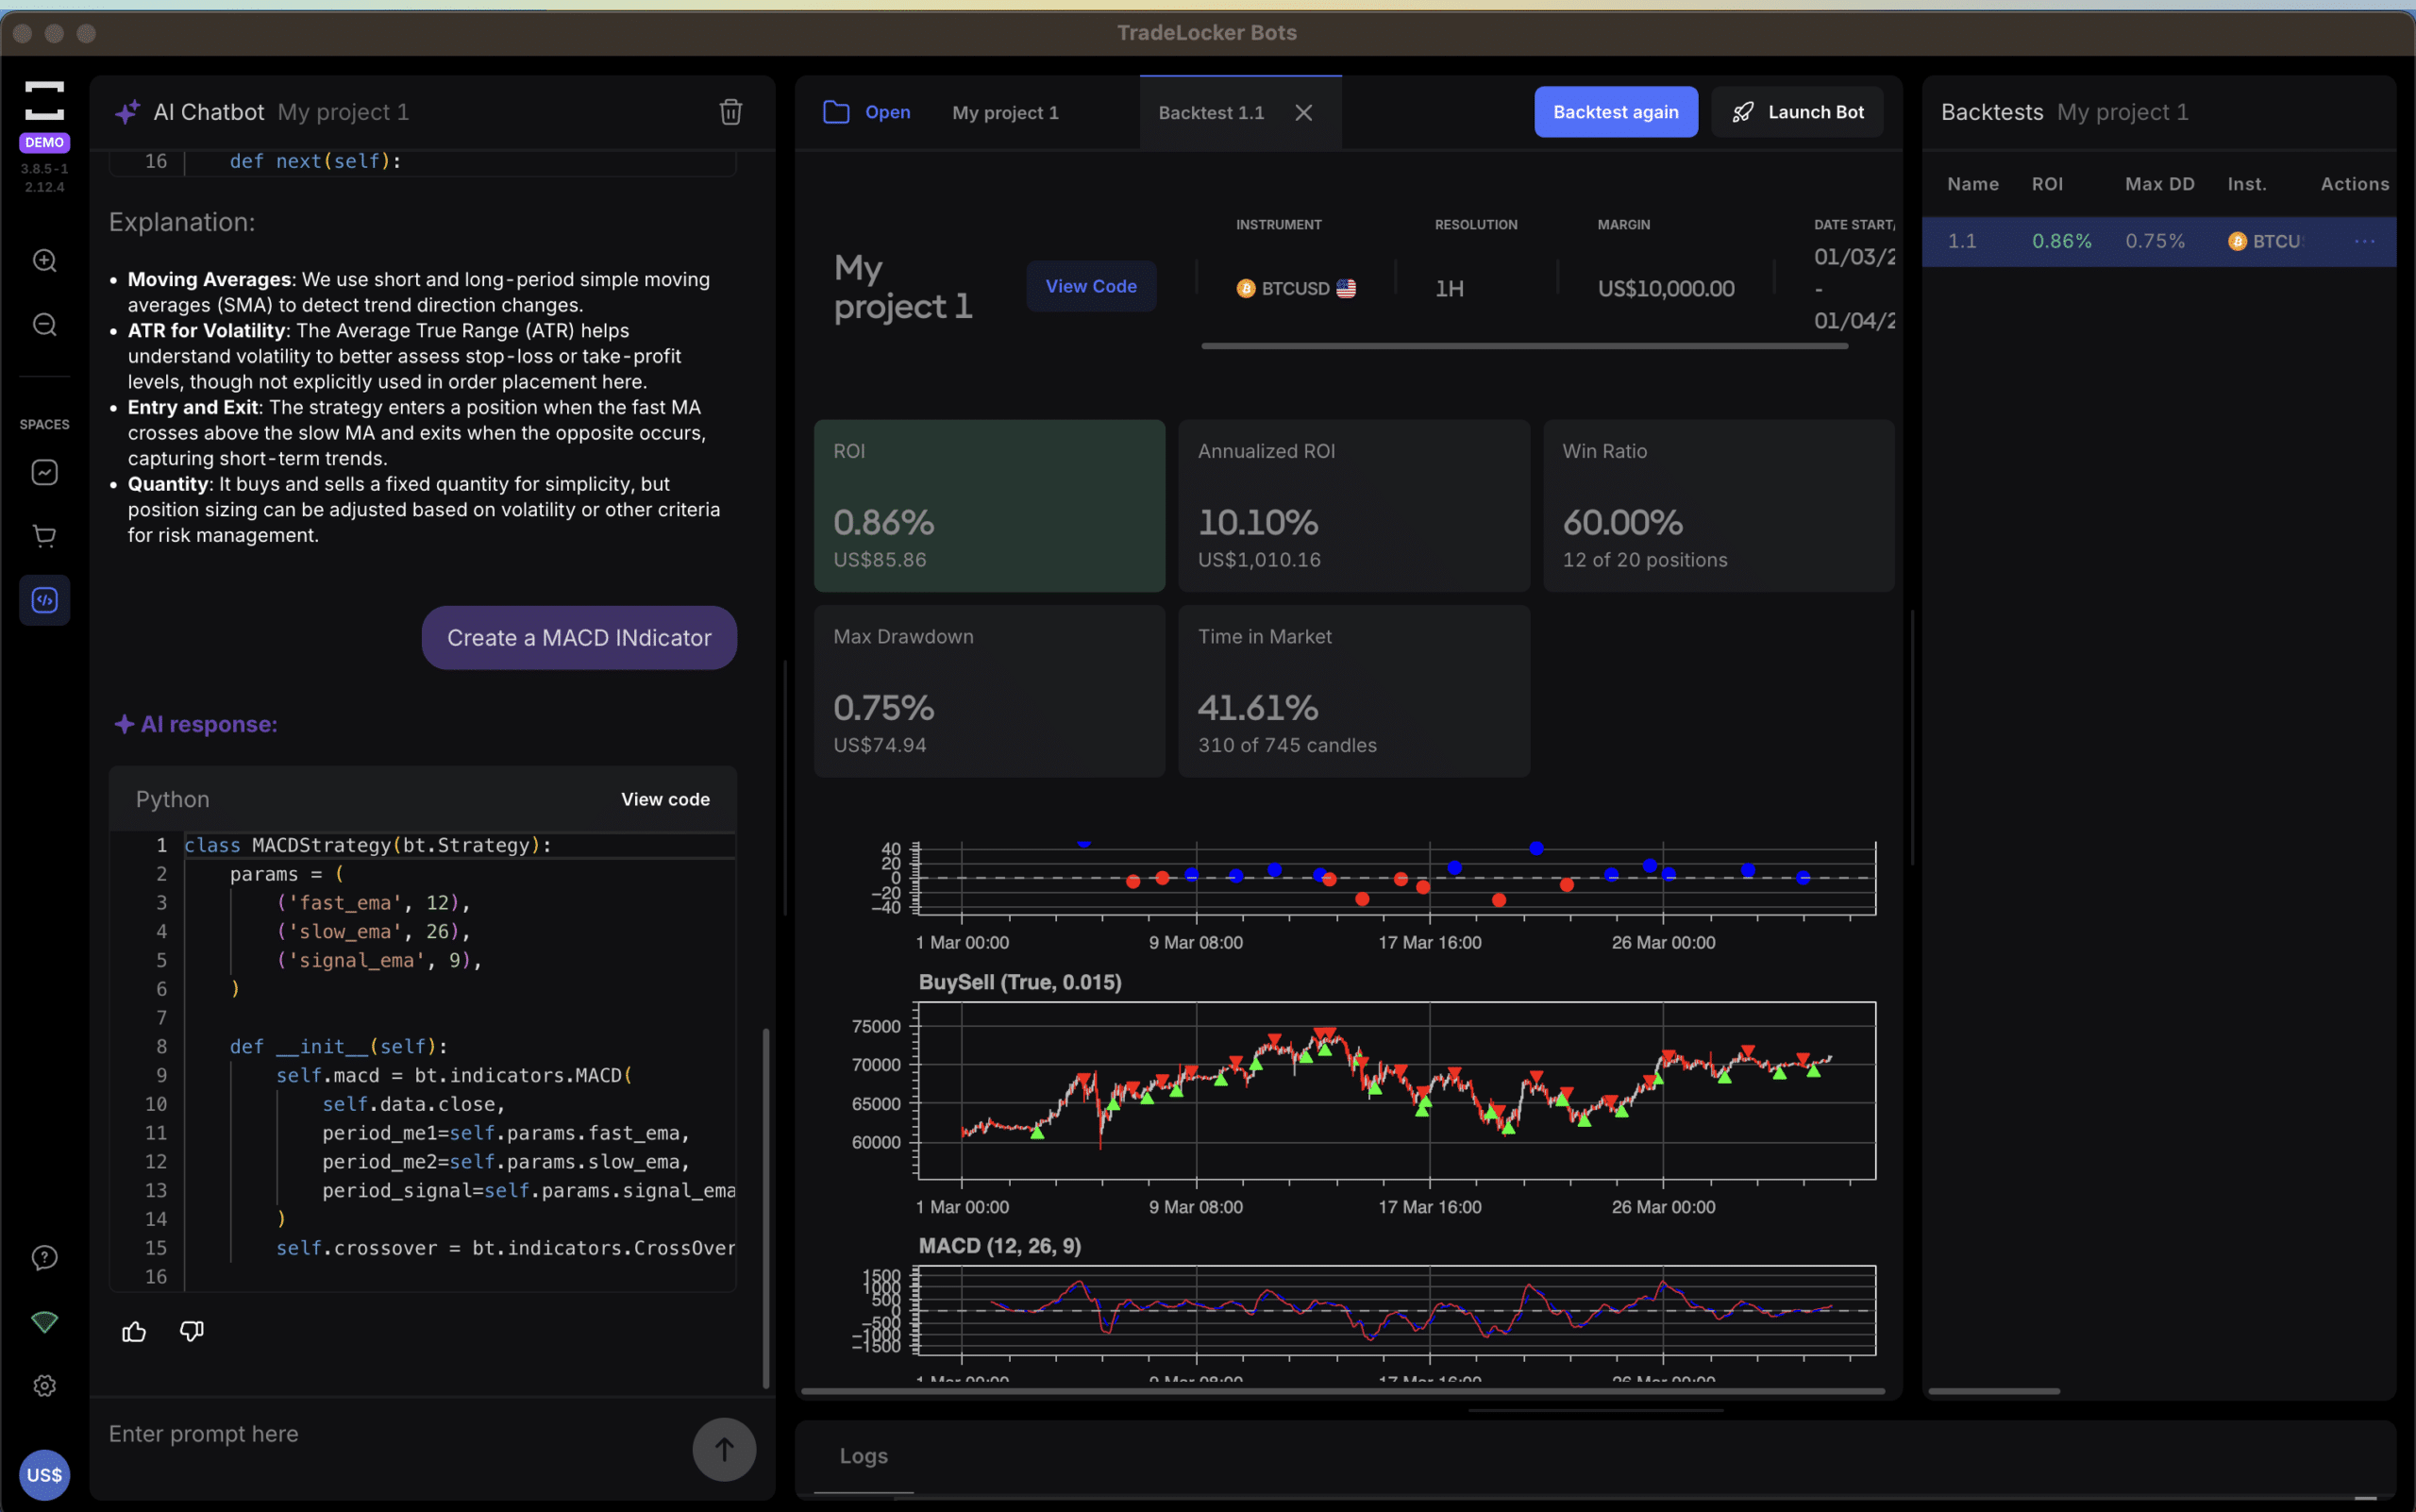
MACD Strategy created in TradeLocker
How to Use the MACD Indicator
1. Crossover Signals: The most basic interpretation of the MACD is when the MACD line crosses above the signal line, it suggests a potential upward trend and can be a buy signal. When the MACD crosses below the signal line, it indicates a potential downward trend and can be a sell signal.
2. Zero Line Cross: When the MACD crosses above the zero line, it signals that the 12-period EMA has moved above the 26-period EMA, which indicates an upward momentum. Conversely, crossing below the zero line shows downward momentum.
3. Divergence: Divergence occurs when the price of an asset moves in the opposite direction of the MACD. A bullish divergence happens when the asset’s price hits lower lows while the MACD makes higher lows. This can indicate that the downward momentum is weakening, and a reversal may be coming. A bearish divergence is when the price reaches higher highs while the MACD forms lower highs, suggesting that the upward momentum may be fading.
You can use the MACD indicator along with other tools like Forex Signal rooms and other indicators like TradesAI to add confidence to your trading.
Advantages of the Indicator
– Simple to Use: The MACD is relatively easy to read, making it a favorite for beginners and experienced traders alike.
– Versatile: It can be used across different time frames, making it suitable for day traders, swing traders, and long-term investors.
– Momentum Indicator: The MACD provides insights into the strength of a trend, which can be invaluable for making informed trading decisions.
Limitations
– Lagging Indicator: Because it is based on moving averages, the MACD tends to lag behind the actual price. This can lead to late signals and potentially missed opportunities.
– False Signals: In volatile markets or during periods of consolidation, the MACD can produce false signals. Traders often combine it with other indicators, like the Relative Strength Index (RSI) or support and resistance levels, to confirm signals.
– Not Ideal for Non-Trending Markets: The MACD performs best in trending markets and may not be as reliable during sideways or choppy trading periods.
Tips for Using this Effectively
1. Combine with Other Indicators: To improve the accuracy of your trading strategy, consider using the MACD alongside other indicators such as volume, RSI, or Bollinger Bands for confirmation.
2. Watch for Divergences: Divergences can be strong indicators of potential reversals, so keep an eye out for these patterns.
3. Adjust Time Frames: Depending on whether you are day trading, swing trading, or investing long-term, adjusting the period settings of the EMAs can provide different insights. Traders can experiment with custom EMA settings to see what works best for their strategy.

MACD strategy created with TradeLocker Bot Studio
Example in Action
Imagine a stock that has been in a downtrend but begins to consolidate. The MACD line crosses above the signal line while the histogram shifts from negative to positive territory. This crossover can be a signal to consider entering a long position. On the other hand, if the stock is trending upward but the MACD line starts making lower highs while the price continues to rise, this bearish divergence could signal a potential downturn.
Conclusion
The MACD indicator is a powerful tool that helps traders and investors identify the momentum and potential trend reversals in financial markets. By understanding its structure, signals, and limitations, you can use it to make more informed trading decisions. While it shouldn’t be relied upon in isolation, the MACD is a valuable component of a comprehensive trading strategy.


