
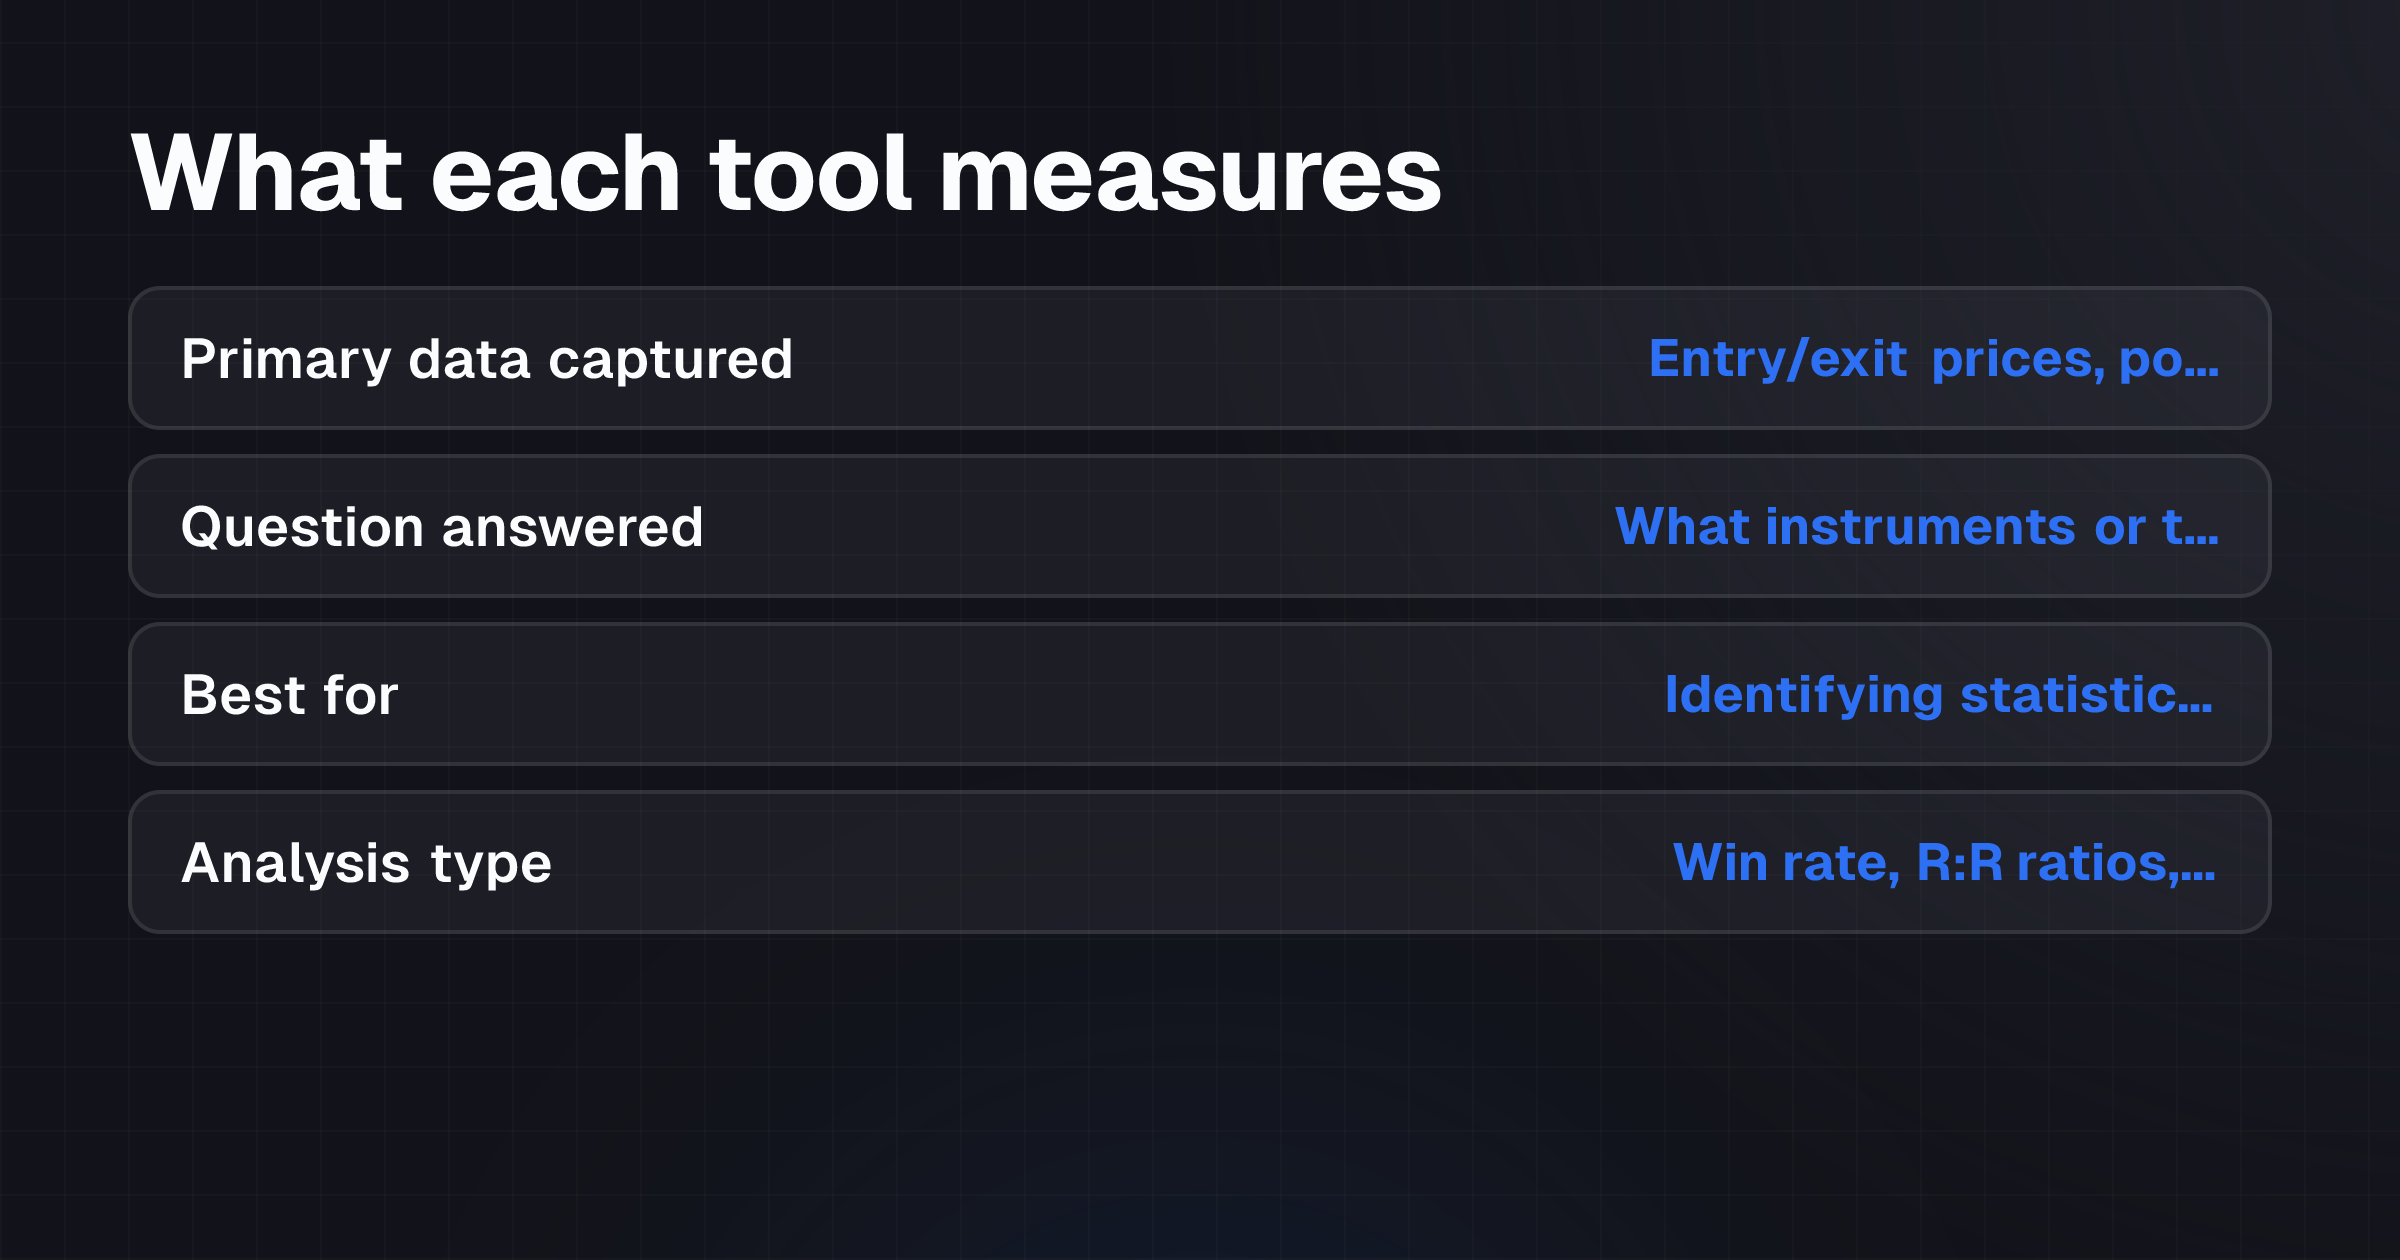
Trading journals and spreadsheets serve different purposes in decision-making. A spreadsheet stores numerical data. Entry prices, exit prices, position size, profit and loss. It calculates performance metrics like win rate and risk-to-reward ratios. A trading journal incorporates those numbers but extends into qualitative territory: pre-trade conviction, emotional state during execution, reasoning behind entry and exit decisions, and post-trade lessons learned. The choice hinges on whether a trader needs statistical performance tracking alone or seeks to connect trading outcomes to behavioral patterns and psychological conditions that influence decision quality.
Research on deliberate practice and metacognition indicates that structured reflection on past performance improves decision-making in complex environments. Studies on behavioral finance have shown that cognitive biases, confirmation bias, fear of missing out, the disposition effect, systematically distort trading choices. Journals designed to prompt psychological reflection are more likely to surface and address these biases than spreadsheets that capture only numerical results.
Quick answer: Which method improves decision quality?
Neither tool guarantees better decisions.
The deciding factor is what the trader intends to measure and change. A spreadsheet answers: "What instruments or timeframes have I profited from, and what is my edge by the numbers?" A journal answers: "What psychological state preceded my worst trades, and how do I recognize and avoid it?" If the primary goal is to identify statistical patterns in performance, a well-organized spreadsheet is sufficient. If the goal is to connect decisions to emotional state, conviction level, and behavioral habits, a dedicated journal, especially one with structured reflection fields, is more effective at surfacing actionable insight.
The effectiveness of either depends entirely on whether the trader uses it consistently and honestly, not just as a data entry task.
The business problem
Traders operate under cognitive load and emotional pressure. Markets move fast, positions carry real financial risk, and decisions must be made with incomplete information. After a trade closes, the immediate outcome, profit or loss, is visible.
The underlying quality of the decision often isn't.
A profitable trade executed for the wrong reasons (luck rather than edge) can reinforce poor habits. A losing trade executed correctly, based on a valid setup that simply lost, can prompt unnecessary rule changes or doubt. Without systematic review, traders can't distinguish between sound decisions with poor outcomes and unsound decisions with lucky outcomes.
The operating problem is this: How can a trader objectively review past decisions, identify which behaviors drive losses, and build reliable decision-making patterns? The tools available fall into two categories. Spreadsheets provide numerical flexibility and low overhead. Journals provide structure and guardrails for psychological reflection.
Neither tool solves the underlying discipline problem, traders must still show up and review regularly, but each creates different friction and incentive patterns.
Where AI helps and where it does not
AI journaling tools (such as those that integrate with trading platforms and parse broker data) can assist in three ways:
Automated data capture: Pulling trade details directly from broker APIs eliminates manual entry errors and reduces the friction of initial logging. The trader still must reflect on why the trade was taken.
Pattern detection across quantitative data: AI can flag statistical relationships faster than manual analysis, for example, identifying that a trader's win rate drops significantly on Fridays or after a losing streak. This assistance surfaces patterns but doesn't explain them.
Behavioral linking: When a journal contains both trade metadata and qualitative fields (conviction level, emotional state, market narrative the trader believed), AI can correlate outcomes with those psychological inputs, showing, for instance, that trades entered in a state of "overconfidence" underperform. This is genuine and valuable because it answers a question humans often can't spot on their own.
Where AI doesn't help:
- Decision-making itself: AI can't decide whether a setup is valid. The trader remains responsible for judgment.
- Preventing bias in entry: Automation can't override a trader's conviction or emotional state at the moment of execution. It can only record it for later review.
- Guaranteeing consistency: A journal, whether AI-assisted or manual, is only as effective as the trader's commitment to use it and honestly record their state of mind. Automation can't enforce discipline.
The distinction matters: AI assists in review and pattern recognition. It doesn't automate the reflective process or replace human accountability for trading decisions.
Implementation model
The choice of tool depends on the trader's current workflow and the specific questions they need answered.
Spreadsheet Implementation
Setup: Create columns for date, instrument, entry price, exit price, position size, profit/loss, and any calculated metrics (R:R ratio, percentage return). Tools like Google Sheets or Excel allow for pivot tables and basic charting without cost.
Data entry: Manual input after each trade closes, or CSV import if the broker supports it.
Analysis: The trader defines their own review process, sorting by date, instrument, or outcome to spot patterns. Statistical calculations (averages, win rate, average winning trade size) are straightforward.
Limitation: Spreadsheets capture outcome and position data but provide no structured fields for the trader to record conviction, emotional state, or reasoning. The trader can add these as free-form notes in a column, but without structure, comparison across many trades becomes cumbersome.
Journal Implementation
Setup: A dedicated platform (commercial or self-built) typically provides pre-defined fields for trade details (entry/exit, size, instrument), qualitative inputs (pre-trade conviction on a scale, emotional state during trade, reason for exit), and a reflection section (what was learned, what would you do differently).
Data entry: Manual input of qualitative fields after the trade, or automated import of quantitative data from the broker with manual annotation of psychological details.
Analysis: The platform can generate reports segmenting trade outcomes by conviction level, showing performance correlation with emotional state, or flagging recurring decision errors. Some platforms integrate AI to detect these patterns automatically.
Governance: Structured fields create a consistent record. The trader is prompted to reflect rather than left to decide what to note.
Hybrid Approach
Many traders combine both: a spreadsheet for raw statistical tracking and a journal for deeper psychological and behavioral review. They import the same trade data into both systems, using the spreadsheet for quick performance metrics and the journal for monthly or weekly reflection sessions that connect outcomes to patterns.
Controls, governance and human review
A critical principle: the trader remains the decision-maker and the reviewer. No tool, spreadsheet or journal, can be trusted to govern trading without human judgment.
Governance Checkpoints
- Data integrity: Verify that trade records match broker statements. Reconcile monthly. Any gap should prompt investigation.
- Honest reflection: The quality of a journal depends on whether the trader records their actual emotional state and reasoning, not a rationalized version of events after the fact. Some traders find it useful to timestamp reflections immediately after a trade closes, before outcome bias can distort memory.
- Pattern verification: When a pattern emerges (e.g., "I lose money on breakout trades"), test it against actual data before accepting it as true. Confirmation bias can make a few losses feel like a trend.
- Rule enforcement: If the journal or spreadsheet reveals a recurring error, the trader should write a specific rule to prevent it (e.g., "No breakout trades after 2pm UTC"). Human accountability is required; software can't enforce rules that depend on judgment.
Human Review Cadence
- Weekly: Quick scan of trade statistics. Win rate, average trade size, largest loss. Takes 15 minutes.
- Monthly: Deep review. Connect outcome patterns to emotional states recorded in the journal. Identify one behavioral habit to change next month. Takes 1-2 hours.
- Quarterly: Review changes in edge across instruments and timeframes. Adjust position sizing or stop-loss rules if data supports it.
Without this discipline, a journal becomes an archive of data, not a tool for improvement.
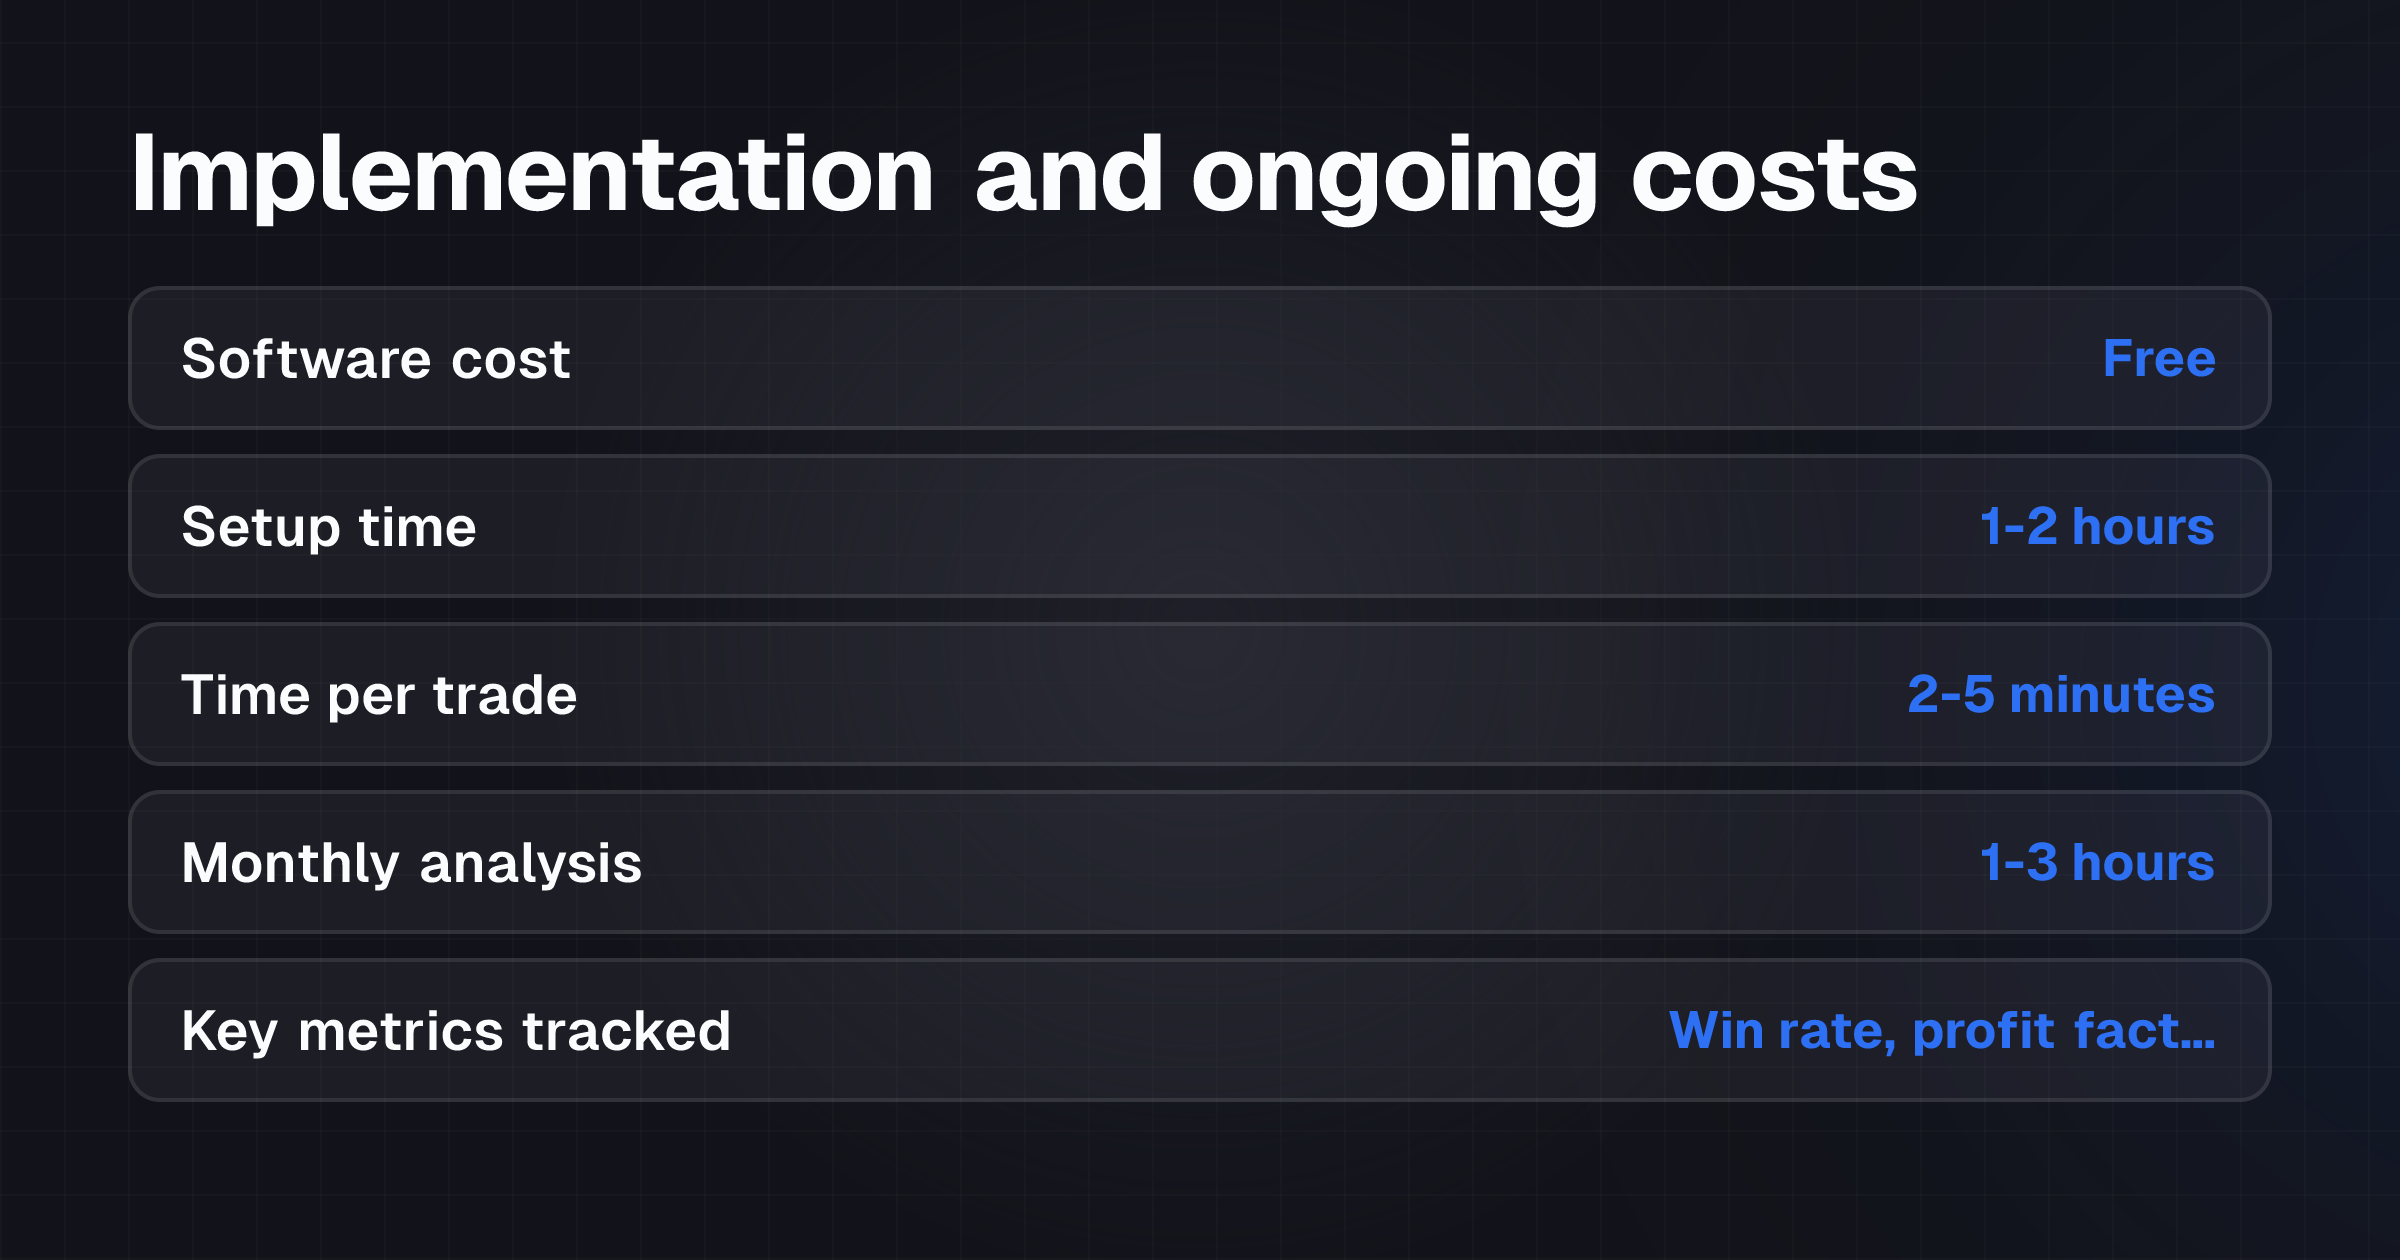
Spreadsheet Costs
- Software: Free (Google Sheets, Excel via personal license).
- Time to setup: 1-2 hours (column design, basic formulas).
- Time per trade: 2-5 minutes (manual entry).
- Time per month for analysis: 1-3 hours (depending on trade frequency).
KPIs to track:
- Win rate (percentage of profitable trades).
- Average win size vs. average loss size.
- Profit factor (gross profit ÷ gross loss).
- Performance by instrument or timeframe.
Journal Costs (Commercial Platform)
- Software: Subscription models vary; some platforms charge monthly, others charge per trade or offer freemium tiers.
- Time to setup: 1-4 hours (depends on platform complexity and whether the trader is customizing fields).
- Time per trade: 5-10 minutes (manual entry of qualitative fields if broker integration is partial).
- Time per month for analysis: 1-3 hours (plus time reading auto-generated reports if the platform provides them).
Additional KPIs:
- Correlation between pre-trade conviction and outcome.
- Win rate in "overconfident" trades vs. "disciplined" trades.
- Frequency of a specific behavioral error (e.g., revenge trading).
- Trend in decision quality over time.
Measurement Framework
The primary measurement isn't whether the tool is used, but whether using it changes behavior and outcomes:
- Baseline period (e.g., first 50 trades): Establish current win rate, average trade size, and drawdown.
- Implementation period (e.g., next 100 trades while using the chosen tool): Track the same metrics.
- Comparison: Did win rate improve? Did average loss size decrease? Did the trader avoid a known behavioral error more often?
A tool is working if the trader's decision patterns improve measurably within 2-3 months. If no change is visible after that time, the likely cause is insufficient discipline in using the tool, not a flaw in the tool itself.
Cost-Benefit Consideration
The value of a journal or spreadsheet lies not in the tool's features but in the trader's follow-through. A free spreadsheet used consistently will yield better insights than a sophisticated platform ignored. The decision should weight setup friction, ongoing data entry burden, and the trader's willingness to review regularly.
Spreadsheet Failures
- Over-reliance on raw numbers: A trader notices a high win rate but ignores that average losses exceed average wins, yielding negative expected value overall. Spreadsheets make it easy to cherry-pick metrics.
- Data entry decay: Initial discipline fades; trades are logged days or weeks late, with emotional details already forgotten or rationalized. The record becomes incomplete.
- No prompting for reflection: A spreadsheet doesn't ask "Why did you take this trade?" or "What could you have done differently?" The trader must impose structure manually, and most don't.
- Unclear analysis workflow: With raw data alone, the trader may not know where to start. No platform is guiding the review.
Journal Failures
- Over-complication: A platform with too many fields or customization options can paralyze the trader. Data entry becomes tedious; the trader abandons it.
- Treating it as record-keeping only: A trader logs every trade in a journal but never reviews it. The journal becomes an archive, not a learning tool.
- Trusting AI patterns without verification: If a journaling platform flags "overconfident trades underperform," the trader should verify this against actual data and context, not accept it as law.
- Inconsistent emotional logging: If a trader rates their conviction or emotional state differently depending on the outcome (high conviction when they win, low conviction when they lose), the data becomes unreliable.
Shared Failure Mode
Both tools fail when the trader lacks discipline or honesty.
A spreadsheet doesn't enforce consistent review. A journal doesn't enforce honest emotional reporting. Neither tool can overcome a trader's resistance to facing uncomfortable patterns in their own behavior.
Implementation checklist
Use this checklist to decide and set up a system:
- Define the question: What specific aspect of decision-making do you want to improve? (e.g., "Stop revenge trading," "Identify which timeframes I profit in," "Understand why I exit early.")
- Choose the tool: Does your question require qualitative reflection (journal) or primarily quantitative analysis (spreadsheet)? If mixed, consider both.
- Verify broker integration: If using a platform with API integration, confirm your broker is supported and test the data import.
- Design fields: Write down exactly what you'll log for each trade. Keep it minimal, 5-7 fields, to avoid abandonment.
- Set a review cadence: Decide when you'll review (weekly, monthly, both) and block the time on your calendar.
- Log 10 trades: Before committing to a tool, test it for 10 trades to assess whether data entry feels natural.
- Review once: Complete at least one full review cycle to see what insights emerge.
- Adjust fields: After the first review, drop fields that felt pointless; add fields that would have answered your questions.
- Commit to three months: Establish a baseline of 50-100 trades before deciding whether the tool is working.
- Compare outcomes: At the three-month mark, compare your decision metrics (win rate, average loss, behavioral error frequency) to your baseline.
Next step
The decision between journal and spreadsheet isn't a product choice; it's a process choice. A spreadsheet is a foundation for traders who want statistical feedback on their performance. A journal is a foundation for traders who want to connect outcomes to emotional patterns and cognitive habits.
Start with the tool that matches your current workflow and carries the lowest setup friction. If you're already tracking trades in a spreadsheet, add one qualitative field (emotional state or conviction level) and review whether that distinction clarifies your patterns. If you're considering a dedicated journal, use the three-month test: set it up, use it consistently, then measure whether your decision quality visibly improved.
Neither tool is a shortcut to better trading. Both are only valuable if used consistently and honestly. The trader who reviews their trades regularly with either tool will improve faster than the trader with the fanciest platform who never reviews. Start, review, adjust, the tool matters less than the discipline.